
A Discord server can grow every week and be quietly dying at the same time.
New members join, the message counter keeps climbing, the activity graph points up and to the right. Meanwhile the people who've been there longest are getting shorter, sharper, and less frequent — and nothing on a standard analytics dashboard shows it, because none of those numbers read what anyone actually said.
Here's what to track instead, and how to run it whether or not you use a tool built for it.
Why the obvious numbers lie to you
Member count, join/leave curves, and messages-per-day all measure activity — how much is happening. None of them measure sentiment — how people feel about what's happening. A launch-day spike and a moderation crisis can produce an identical activity graph. So can a genuinely thriving server and one where a growing member count is masking an exodus of the people who mattered most.
Activity-tracking bots do this job well — counting is a real, useful capability. But counting is not reading, and community health lives in the reading.
The five signals worth tracking
Sentiment itself isn't one number either. A single "how positive is today" score is easy to game with a burst of hype messages and easy to miss a slow-burning problem with, because it treats every signal the same. A more honest health score weighs several things at once:
Polarity — the ratio of clearly positive to clearly negative messages, not an average. A raw ratio inflates fast once a server gets enthusiastic, so it's worth deflating extreme highs rather than taking them at face value — a community that's 95% positive this week and 70% positive last week isn't actually 25 points healthier.
Velocity — the week-over-week direction, not a snapshot. A 7/10 sentiment score means very different things depending on whether last week was a 5 or a 9. Direction is often more actionable than the level.
Volume — message-count changes, in context. A spike is only informative relative to a server's normal baseline, and it needs to be read alongside sentiment, not instead of it — the same volume spike is a launch or a crisis depending on what's actually being said.
Extremity — how many messages land at the very ends of the scale, not just the middle. A server that's calmly neutral all week reads differently from one running hot on both ends — visible excitement and visible frustration at once, which a simple average would flatten into "fine."
Engagement quality — sentiment weighted toward messages that got real engagement, not toward whoever posted most. A complaint with fifty reactions and a long reply thread carries more signal than the same complaint posted into silence.
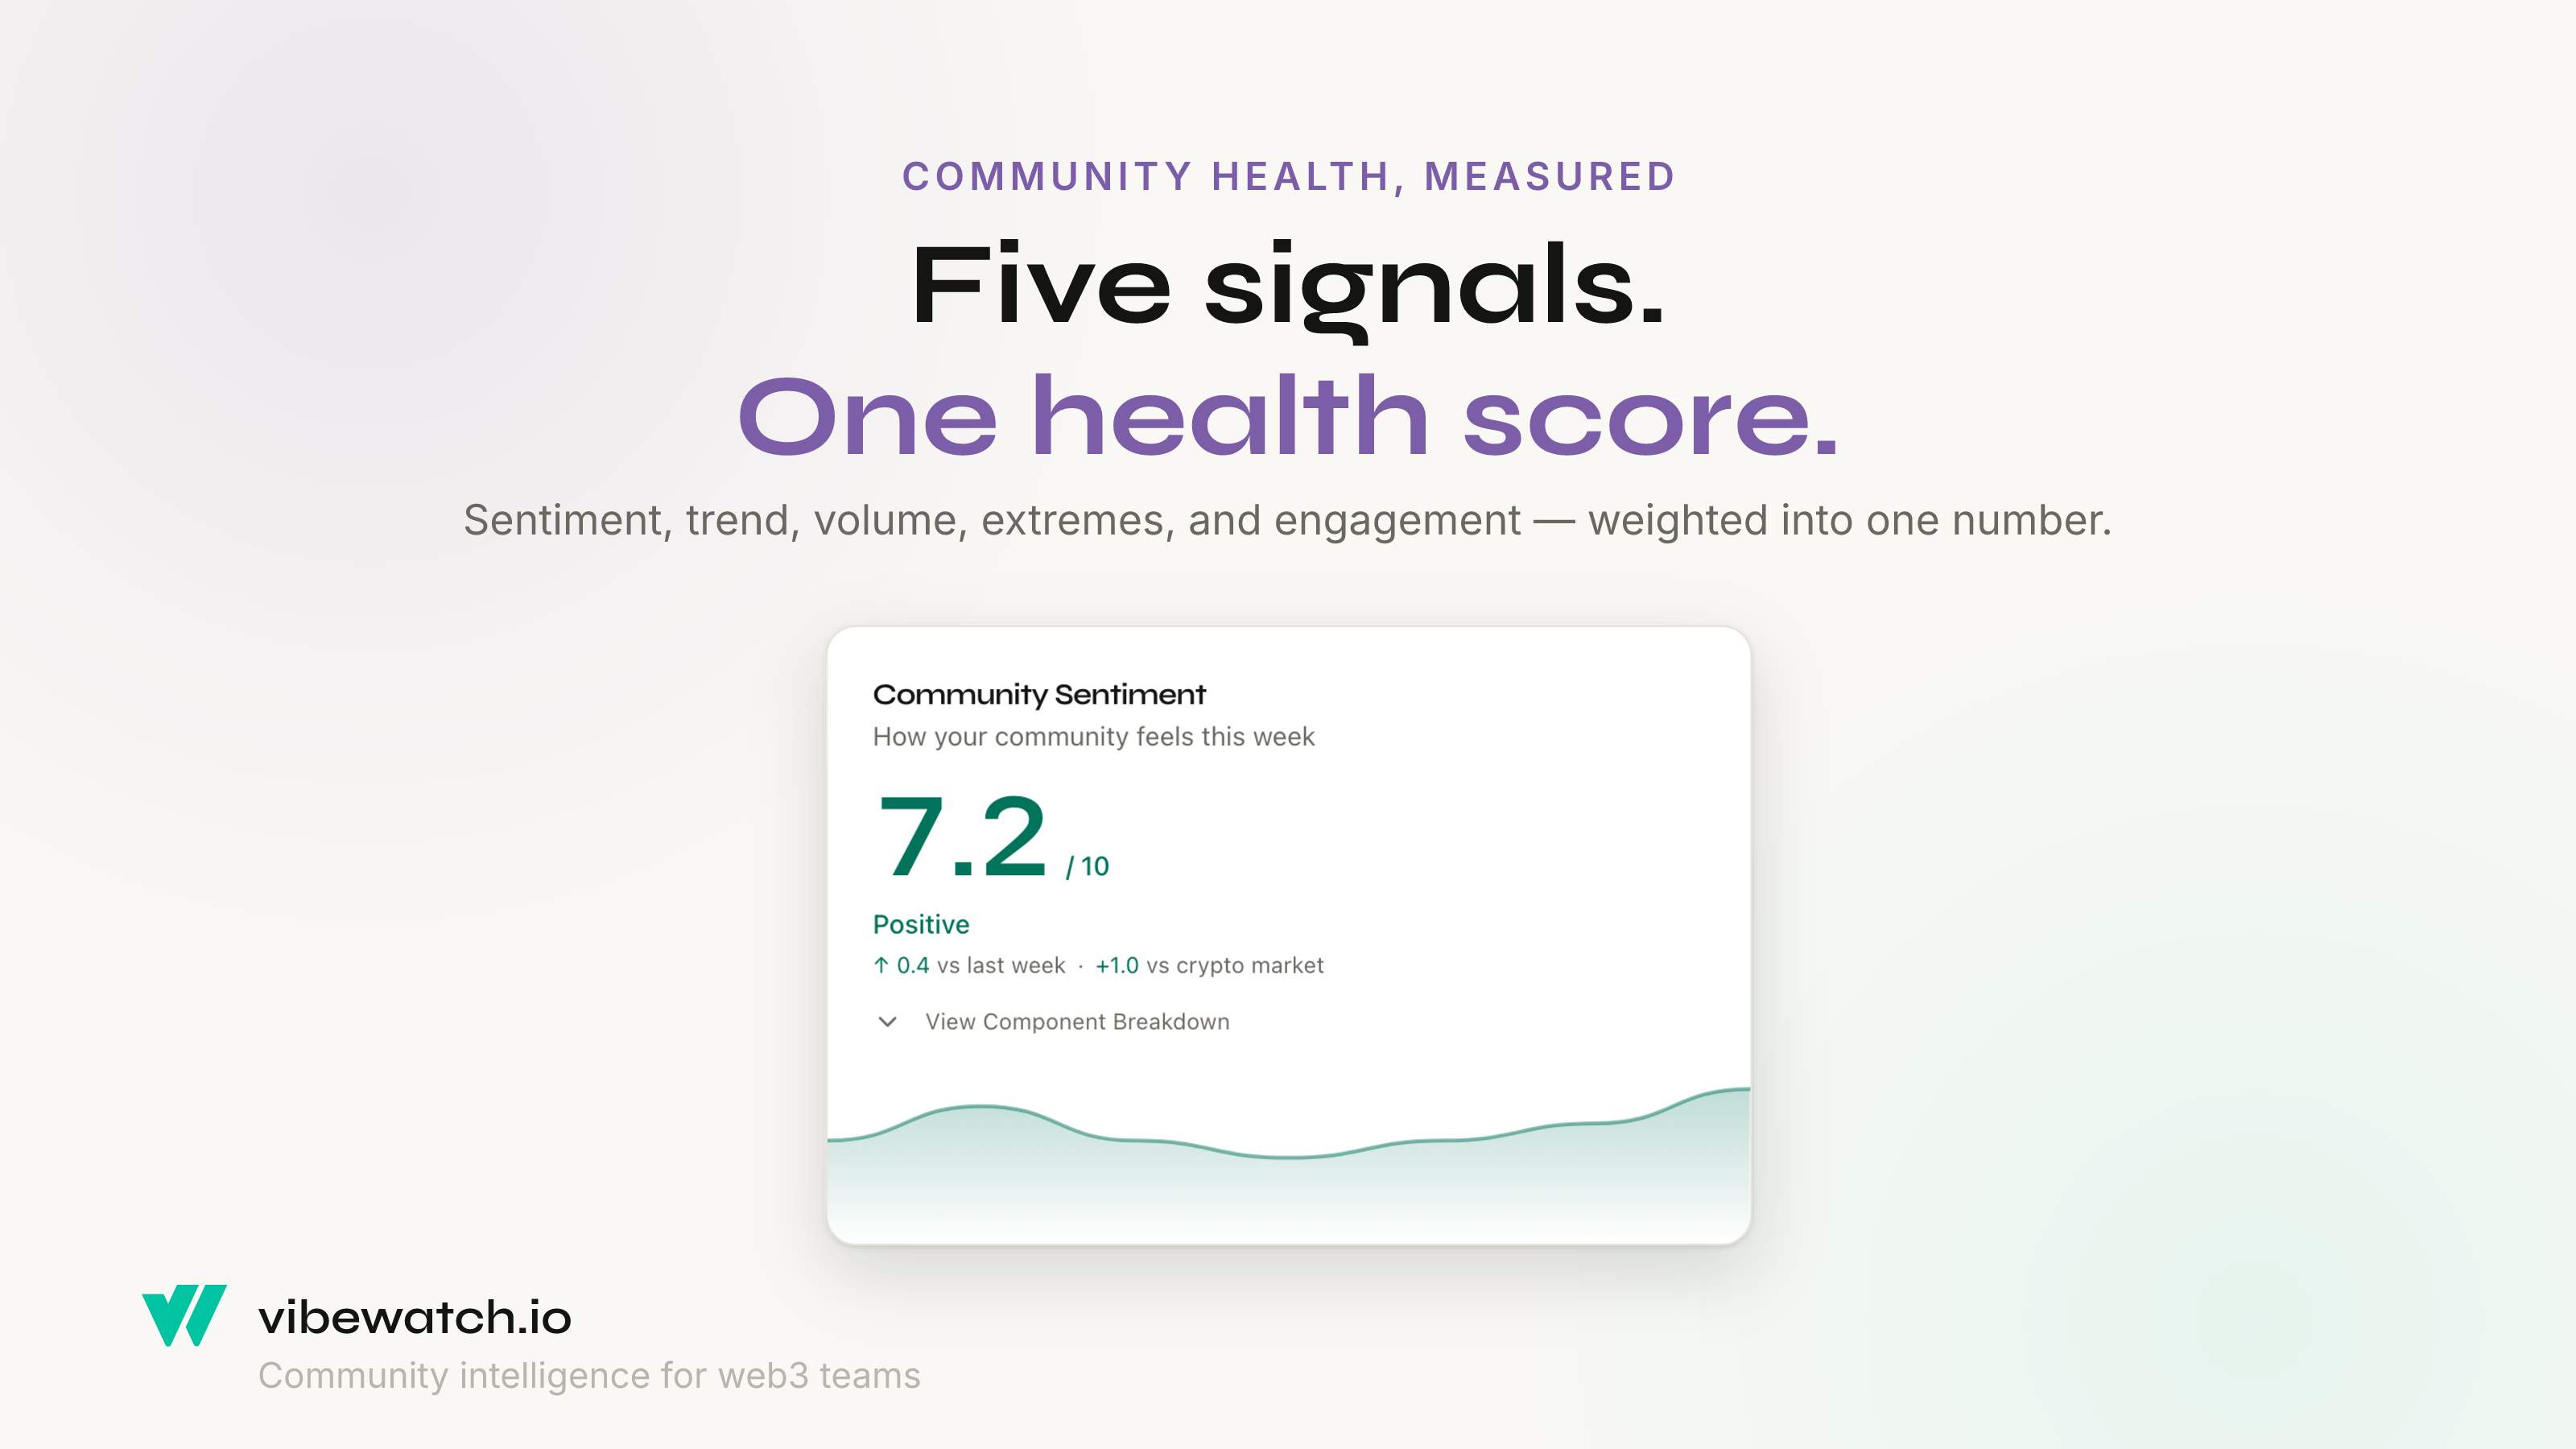
Weighted roughly 35/30/15/15/5 in that order, these five signals are the same idea behind the Fear & Greed index applied to a community instead of a market: no single number is trustworthy, but a weighted blend of several imperfect signals is harder to fool than any one of them alone.
A framework you can run without any tool
You don't need software to start applying this. A community manager can run a version of it by hand:
- Sample across channels, not just the loudest one. The general chat is not the whole server; a support channel running hot might be the actual story of the week.
- Track the trend, not the day. One bad afternoon is noise. Three weeks of declining positivity in the same channel is a pattern.
- Watch both extremes. Don't just average sentiment — count how many messages this week were unambiguously glowing and how many were unambiguously furious. A rising count on either end is worth a look even if the average barely moves.
- Weight by engagement, not just headcount. A complaint that a dozen people piled onto matters more than the same complaint that got zero replies.
- Don't mistake quiet for healthy. A server that's gone quiet after a controversial decision isn't calm — it's often people who've stopped bothering to say anything.
Run that pass weekly, on a fixed day, so the comparison is apples to apples.
Where this gets hard to do by hand
The framework above works, but it doesn't scale past a few hundred messages a week, and a few problems compound the more you rely on eyeballing it: sentiment read out of context is unreliable (a "finally" means something completely different depending on what it's replying to), a manual scan doesn't remember what you decided last time you saw the same pattern, and last month's viral moment tends to keep outranking this week's actual story in any raw-volume ranking, because cumulative counts never decay.
That's the specific gap Vibewatch is built to close. It scores every message 1–10 for sentiment with the surrounding thread and your brand's own vocabulary attached — here's the full breakdown of what it knows before it scores anything — and rolls those scores into the same five-signal composite index described above, visible in-app via View Component Breakdown so the number is never a black box. When you correct a score, that correction becomes a worked example for the next scoring pass, and Vibewatch periodically distills your accumulated corrections into rules for how your specific community talks.
The "last month's incident still ranks #1" problem gets a direct fix too: trending themes are ranked over a rolling 7-day window with a 60-hour half-life, so an old spike fades out of the rankings on its own instead of sitting pinned at the top by cumulative volume. And each weekly report surfaces a Worth Addressing section — up to three actionable themes clustered from the week's messages, each with a verified count and citations linking back to the real messages, so a theme that made the report is never inflated. The whole thing arrives as a narrative report to Slack, email, or Notion, previewed and approved before your team sees it, not a dashboard someone has to remember to check.
Tools that count vs. tools that read
If your only need is activity stats — growth curves, message counts, retention — a dedicated Discord stats bot does that job well and often for free. It just won't tell you why a spike happened, only that one did. Community-ops platforms built around member graphs and engagement scoring, like Common Room, sit somewhere in between — real in-server access, but pointed at routing signal to sales and DevRel rather than at how the community feels. We wrote up the fuller landscape, including where the widely-used activity bots and the SMB listening tools stand on Discord specifically, in our guide to Discord sentiment tools.
Frequently asked questions
Is a growing member count a sign of a healthy Discord? Not on its own. Member count measures acquisition, not sentiment — a server can add members every week while its most engaged long-time voices get quieter or more negative. Track sentiment and engagement quality alongside growth, not instead of it.
How often should I check my community's sentiment? Weekly, on a fixed day, so you're comparing trend to trend rather than day to day. Sentiment velocity (this week vs. last week) is usually more useful than any single day's reading.
What counts as a "good" sentiment score? There's no universal number — a young server discussing a rough launch week and a mature community in a quiet period will land in different ranges even when both are healthy. What matters more is direction over time and whether the extremes (the very positive and very negative ends) match what you'd expect given what actually happened that week.
Can I measure community health without reading every message myself? Manually, only up to a point — a few hundred messages a week is doable by hand, a few thousand isn't. That's the specific problem automated sentiment scoring solves: reading every message in context and rolling it into a weekly report, without asking a person to sit through the raw feed.
Does message volume matter at all? Yes, but only in context. A volume spike is informative relative to a server's normal baseline and alongside what's actually being said — the same spike is a launch or a moderation crisis depending on the content, which is exactly what a pure activity count can't tell you.
The five-signal index above is the one Vibewatch computes, with View Component Breakdown showing every input. Start a free Vibewatch trial and the first weekly report scores your server against it.